Posts

Using a Python Dictionary to Cache Results of a Recursive Function

Image
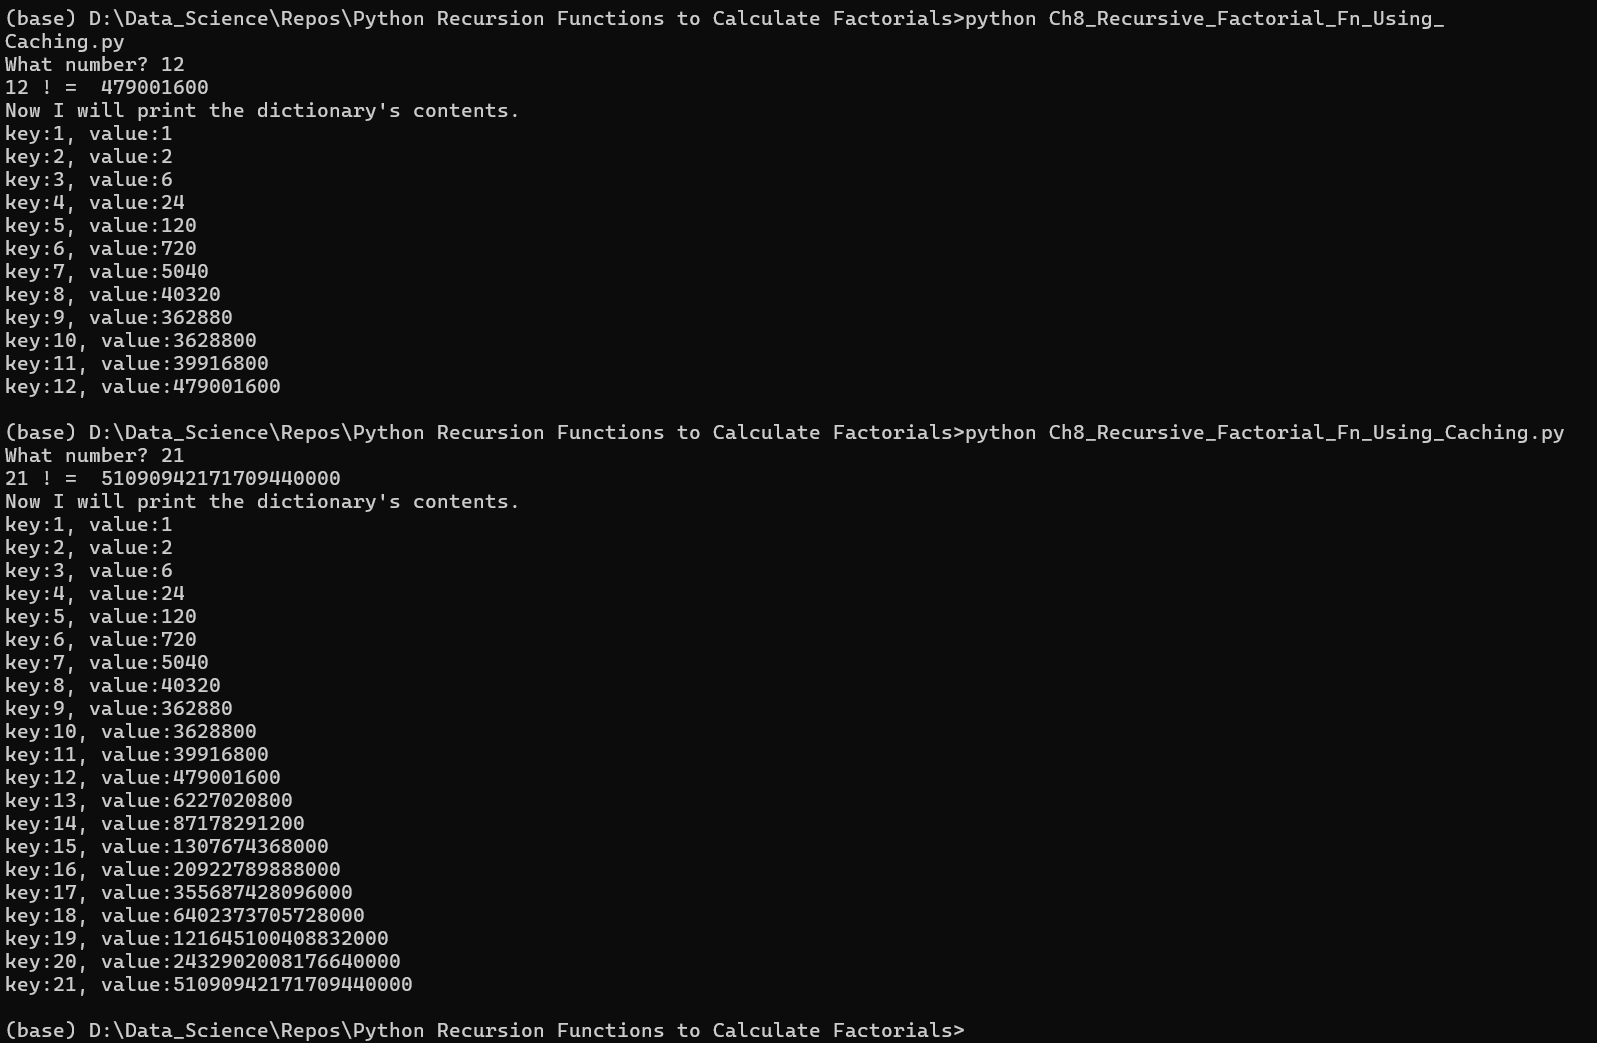
 I used recursive functions to calculate factorials. I created my own dictionary to cache the results of successive calculations.  #with caching, using my own dictionary cache={} def factorial(n):     if n<=1:       #this is the base case         return 1     else:         cache[n-1]=factorial(n-1)         cache[n]=cache[n-1]*n     #we don't get to this line until previous line has got to n=1         return cache[n] # ask user to input a number the factorial of which the user wishes to find num= int(input("What number? ")) print(num,'! = ',factorial(num))     # the recursive factorial function is called here print("Now I will print the dictionary's contents.") #print out the dictionary for key, value in cache.items():     print(f'key:{key}, value:{value}') Click on this image to increase its size and see the results of running the code twice.

Math Puzzle Solved with Python

Image
This is a question in a elementary school math text.  The problem is stated in the first 5 comments. Whatever you input for the 2 days, the answer is always 21. # Mrs. Simpson waters her geraniums once every 3 days, and she waters her other house plants once a week. # How often does Mrs. Simpson water all the plants on the same day? # Geraniums are watered once every 3 days i.e. if watered on Monday, then watered again on Thursday. # Other plants are watered only once a week. # We have to determine how many days it takes for the watering days to be the same day. # Best way to do this is to first wait for the day to match, then count the number of days until the next #matching day. Otherwise, we get different answers for different geranium watering days.  # Ask for the first day that geraniums are watered. spelling_indicator1 = 0 while spelling_indicator1 == 0:      germ_first = input('What is the first day that the geraniums are watered (enter at least first 2 letters)? ').lowe

R Project #1: Hypothesis Testing With t-Test

Image
  QUESTION: Consider the gain in weight of 19 female rats between 28 and 84 days after birth. 12 were fed on high protein diet and 7 on a low protein diet. Using the data given below, test the hypothesis that there is no difference in weight gain between female rats raised on a high-protein diet versus those raised on a low-protein diet. Use a significance level of 𝛼 = 0.05 and assume equal variances.  Weight Gain Measured in Grams: High protein: 134,146,104,119,124,161,107,83,113,129,97,12  Low protein: 70,118,101,85,107,132,94  SOLUTION: The Null Hypothesis here is that there is no weight gain difference between the 2 groups of rats. It will be shown that there is no reason to reject the Null Hypothesis. This will be done using the R code shown below.  #This will be a test involving two population means #mu1 is population mean-of-weight-gain of high protein rats #mu2 is population mean-of-weight-gain of low protein rats # H0: mu1 - mu2 = 0 i.e. no difference in weight gain (THIS IS

Excel Project With Pivot Tables: Citi Bikes

Image
This is a project that looks at the data from a company called Citi Bike. It is a bike rental company in New York City that allows clients to pick-up a bike at one of its several locations and leave the bike at another location. The data can be found at Kaggle.com.  I determined the following using Excel's Pivot Tables:  1) the start locations frequented most and least 2) the end locations frequented most and least 3) use of service by age group 4) average duration of trip by age group This info may help Citi Bike determine if some stations should be shut down or determine if more bikes should be placed at certain stations. Citi Bike may also use this information to target certain age groups and neighborhoods in its advertising.  The Excel spreadsheet was imported into Google Docs so that a link to the worksheet could be published here: https://docs.google.com/spreadsheets/d/e/2PACX-1vRhSnt-5l2kQL1gwgSrsDpCU9AYOkjDa9VA-X53IuSnk5gasNFq3wiKzzZE3TnTYA/pubhtml As a Google worksheet, th